WeChat public account
Asia's domination of world duck production continues, with production increasing over the last 15 years, writes industry analyst Terry Evans.
Between 2000 and 2013, industry growth in this region averaged 3.5 per cent per year which was just above the global figure of 3.2 per cent.
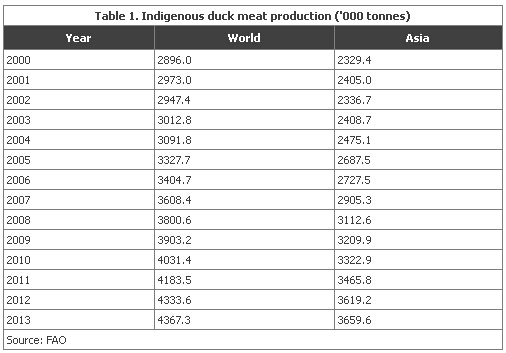
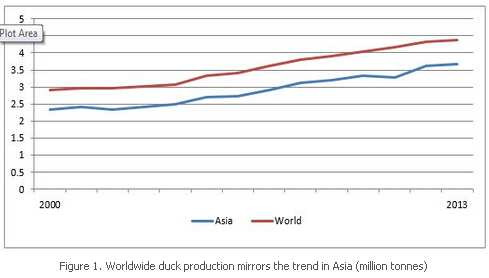
World production rose from a shade below 3 million tonnes to almost 4.4 million tonnes (Table 1 and figure 1). The comparable figures for Asia were 2.3 million tonnes and nearly 3.7 million tonnes. Thus, Asia succeeded in boosting its share of global output from 80.4 per cent to 83.8 per cent.
The data presented in these tables are what the Food and Agriculture Organisation (FAO) considers to be indigenous production, this being the eviscerated weight from the slaughterings of domestically grown birds plus the meat equivalent of birds exported live.
In terms of the numbers of ducks slaughtered worldwide, the total went up from 1,969 million to 2,886 million. For Asia the figure rose from 1,727 million to 2,628 million. In this instance, Asia’s contribution rose from 87.7 per cent to 91.1 per cent.
These shares were higher than those for duck meat output because the average eviscerated weight in Asia at 1.4kg was significantly lighter than in the other regions of the world and the global average of 1.5kg.
Industry growth in Asia has been a commendable 3.5 per cent per year making this the most important duck producing region. Not surprisingly, mainland China is the key producer, output having accelerated from 1.8 million tonnes to more than 2.9 million tonnes, at which point it represented almost 80 per cent of the regional total and more than two-thirds of the global figure.
Malaysia’s industry has expanded by 3.6 per cent per year and currently annual output could well exceed 130,000 tonnes.
The fastest growing industry in the region would appear to be Myanmar where production, stimulated by an almost 11 per cent per year increase, has jumped from less than 29,000 tonnes to 107,000 tonnes
Duck production in Viet Nam recorded a positive near 4 per cent per year increase for most of the review period, with output exceeding 100,000 tonnes a year since 2011.
Taiwan’s industry has changed little over the period, while output in recent years has been significantly below the 2005 level of 71,500 tonnes.
The Korean Republic has posted positive gains with production coming close to 70,000 tonnes in 2013.
In contrast to the trends exhibited by most of the other leading producers, Thailand recorded a cutback from more than 100,000 tonnes a year to less than 90,000 tonnes in 2013.
A similar picture has been evident in India where production has declined slightly in recent years, the 2013 figure amounting to less than 30,000 tonnes compared with 46,000 tonnes in 2000.
Virtually all of Europe’s ducks are produced in European Union countries. Although there is a wide difference between sources on the estimates of production in 2000, the broad view since 2009 is that output in Europe has averaged around 500,000 tonnes a year with only a couple of thousand tonnes being grown outside the EU. During the review period, growth in this region was slow averaging only 1.5 per cent per year.
France is undoubtedly the biggest producer in Europe, though estimates of production in this country vary widely according to source. In 2013 for example the FAO has put out a figure of 280,000 tonnes, while an annual report by the Association of Poultry Processors and Poultry Trade in the EU countries (AVEC) presents a much lower figure of 233,000 tonnes.
Second largest producer in the Community is Hungary. Here duck meat output climbed at 3 per cent per year from 43,500 tonnes in 2000 to 61,500 tonnes in 2012, but then eased back a little to 59,600 tonnes in 2013.
The trend in Germany was similar to that in Hungary. With production of more than 56,000 tonnes in 2013 Germany was Europe’s third largest producer.
Although the UK ranks fourth in Europe, production has fallen somewhat from more than 40,000 tonnes in 2000 to around the 31,000 tonnes mark at the end of the review period.
Although small, duck production in Africa expanded by almost 4 per cent per year from 56,000 tonnes to 93,000 tonnes (Table 2). This region has only one major producer-Egypt, where output increased from 38,000 tonnes (67 per cent of the regional total) to 71,500 tonnes (77 per cent).
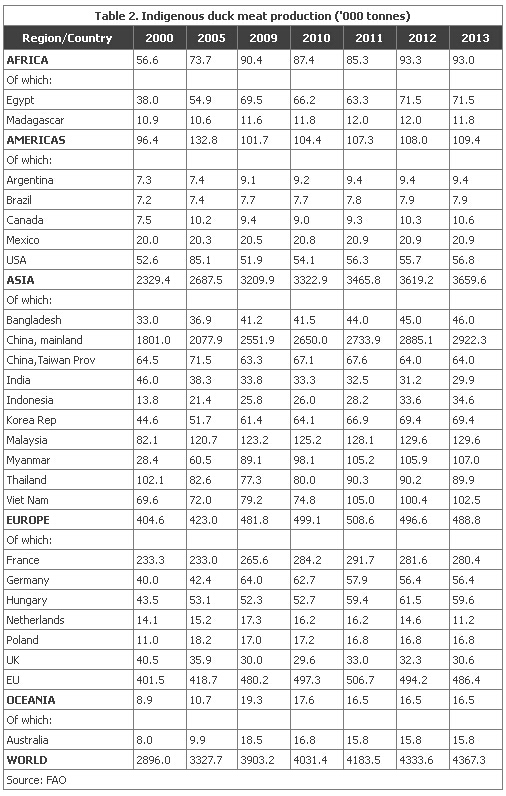
The only other significant producer is Madagascar where output has shown a small gain from 11,000 to 12,000 tonnes.
Duck production in the Americas is only a little larger than in Africa, output having risen from 96,000 to 109,000 tonnes between 2000 and 2013, as growth averaged just 1 per cent per year.
While the USA is the largest producer, output over the later part of the review period stagnated at about 56,000 tonnes a year.
Mexico has seen virtually no increase from around the 21,000 tonnes a year level.
Canada’s production expanded at 2.7 per cent per year from 7,500 tonnes in 2000 to a new “high” of 10,600 tonnes in 2013.
Argentina and Brazil are the only other countries in the Americas with annual outputs of more than 2,000 tonnes.
The production pattern for Oceania mirrors the developments in Australia as this country represents three -quarters of the regional total. After more than doubling to 2009, Australia’s industry has since contracted to around 16,000 tonnes a year.
Trade in fresh/frozen duck meat almost doubled between 2000 and 2012 from 107,000 tonnes to 206,000 tonnes (Table 3). Two-thirds of duck meat exports came from Europe which rapidly expanded sales in 2012 (Table 3 and figure 2).

In 2012, a massive 99 per cent Europe’s exports were sold by EU member states, with some 18 per cent of this business being conducted with countries outside the Community.
Four countries dominated Europe’s duck export trade as France, Hungary, Germany and the Netherlands accounted for around of 84 per cent of all sales from EU countries which amounted to 134,600 tonnes in 2012 (Table 3 and figure 3).

In 2012, France exported almost 37,000 tonnes which was four times as much as in previous years. Sales were made to more than 70 countries, most of which took small quantities.
Her leading customers were Germany (buying 12,100 tonnes), Hong Kong (4,800 tonnes), the UK (2,900 tonnes), Denmark (2,400 tonnes) and Belgium (2,000 tonnes), these five purchasing some 24,200 tonnes or 66 per cent of the 2012 total.
Number two in the European export league is Hungary which sold some 34,300 tonnes in 2012. Her main customers, taking 90 per cent of the total in that year, were Germany (8,500 tonnes), the Czech Republic (6,200 tonnes), Slovakia (3,600 tonnes), Austria (2,800 tonnes), the UK (1,900 tonnes), the Russian Federation (1,700 tonnes), France (1,600 tonnes), Hong Kong (1,500 tonnes), Belgium (1,400 tonnes) and Japan (1,300 tonnes).
Of the near 18,200 tonnes sold by the Netherlands, Germany received almost 7,200 tonnes, Spain 3,700 tonnes, France 1,600 tonnes and the UK 1,000 tonnes.
There are many reasons (explained in other regional reports) why the global figures for exports and imports do not balance in a particular year.
In general, total exports tend to exceed imports as the bulk of the data on exports are normally collected from just a few countries, while far more countries are involved in importing making it more difficult to collect all the relevant data.
Clearly imports into Africa, the Americas and Oceania are small hence the key importing regions are Asia and Europe.
Within Asia, Hong Kong is the only significant importer and it would appear that the figure for 2012 of 15,000 tonnes is grossly understated considering that conventionally this country's purchases have been in the region of 55,000 tonnes a year and that the detailed export data for 2012 indicated that shipments from mainland China to Hong Kong amounted to more than 23,000 tonnes!
In Europe, or more precisely the European Union, the main buyers in 2012 were Germany (29,500 tonnes), France (13,000 tonnes) and the Czech Republic (12,000 tonnes).
France with 12,700 tonnes and Hungary (8,800 tonnes) were the leading suppliers to the German market, while Bulgaria (5,100 tonnes), Belgium (2,900 tonnes) and Hungary (1,600 tonnes) accounted for the bulk of France’s imports.
Hungary (6,600 tonnes) and Germany (2,300 tonnes) were the key suppliers to the Czech Republic.
Duck imports into the Russian Federation reached a new “high” of 6,000 tonnes in 2012 purchases primarily being made from Germany (2,600 tonnes) and Hungary (1,800 tonnes).